Data and information shown on this page reflects the situation at 1 January 2021. For more information, see Annual report 2020 - Natural resources and Geothermal energy in the Netherlands.
As at 1 January 2021, there were 495 proven accumulations of natural gas in the Netherlands and almost half (221) were in production. A further four gas fields were being used to store gas (in addition to the one gas storage facility in salt caverns). The remaining 111 accumulations were not developed, but it is expected that 25 of them will be brought into production in the next five years (2021–2025). Development of the remaining 86 remains uncertain. 158 of the accumulations that were not producing at the time, had been producing previously but their exploitation had been (temporarily) ceased.
Natural gas resource estimates
On 1 January 2021 the total gas resource in developed and undeveloped accumulations was 138.2 billion Nm3. The remaining reserves totalled 92.4 billion Nm3 of which 6.6 billion Nm3 reserves in the Groningen field and 85.8 billion Nm3 in the remaining (small) fields. That part of the contingent resources which is likely to be produced, is partly in currently producing accumulations but the greater share is in as yet undeveloped accumulations. All in all, the small fields contain contingent resources of 32.9 billion Nm3 on land and 12.9 billion Nm3 at sea. As described above the Groningen field does not contain any contingent resources.
Proven natural gas accumulations as at 1 January 2021, classified according to their status.
|
Status of gas accumulation |
On land |
At sea |
Total |
|
I. Developed |
|
|
|
|
a. Producing |
91 |
130 |
221 |
|
b. Natural gas storage* |
5 |
0 |
5 |
|
II. Undeveloped |
|
|
|
|
a. Production to start 2021-2025 |
8 |
17 |
25 |
|
b. Other |
35 |
51 |
86 |
|
III. Production ceased |
|
|
|
|
a. Temporarily ceased |
20 |
14 |
34 |
|
b. Ceased |
48 |
76 |
124 |
|
Total |
207 |
288 |
495 |
Netherlands natural gas resources as at 1 January 2021, in billion Nm3.
|
Area |
Reserves |
Contingent resources (development pending) |
Total |
|
Groningen |
6.6 |
- |
6.6 |
|
On land |
28.4 |
32.9 |
61.3 |
|
At sea |
57.4 |
12.9 |
70.3 |
|
Total |
92.4 |
45.8 |
138.2 |
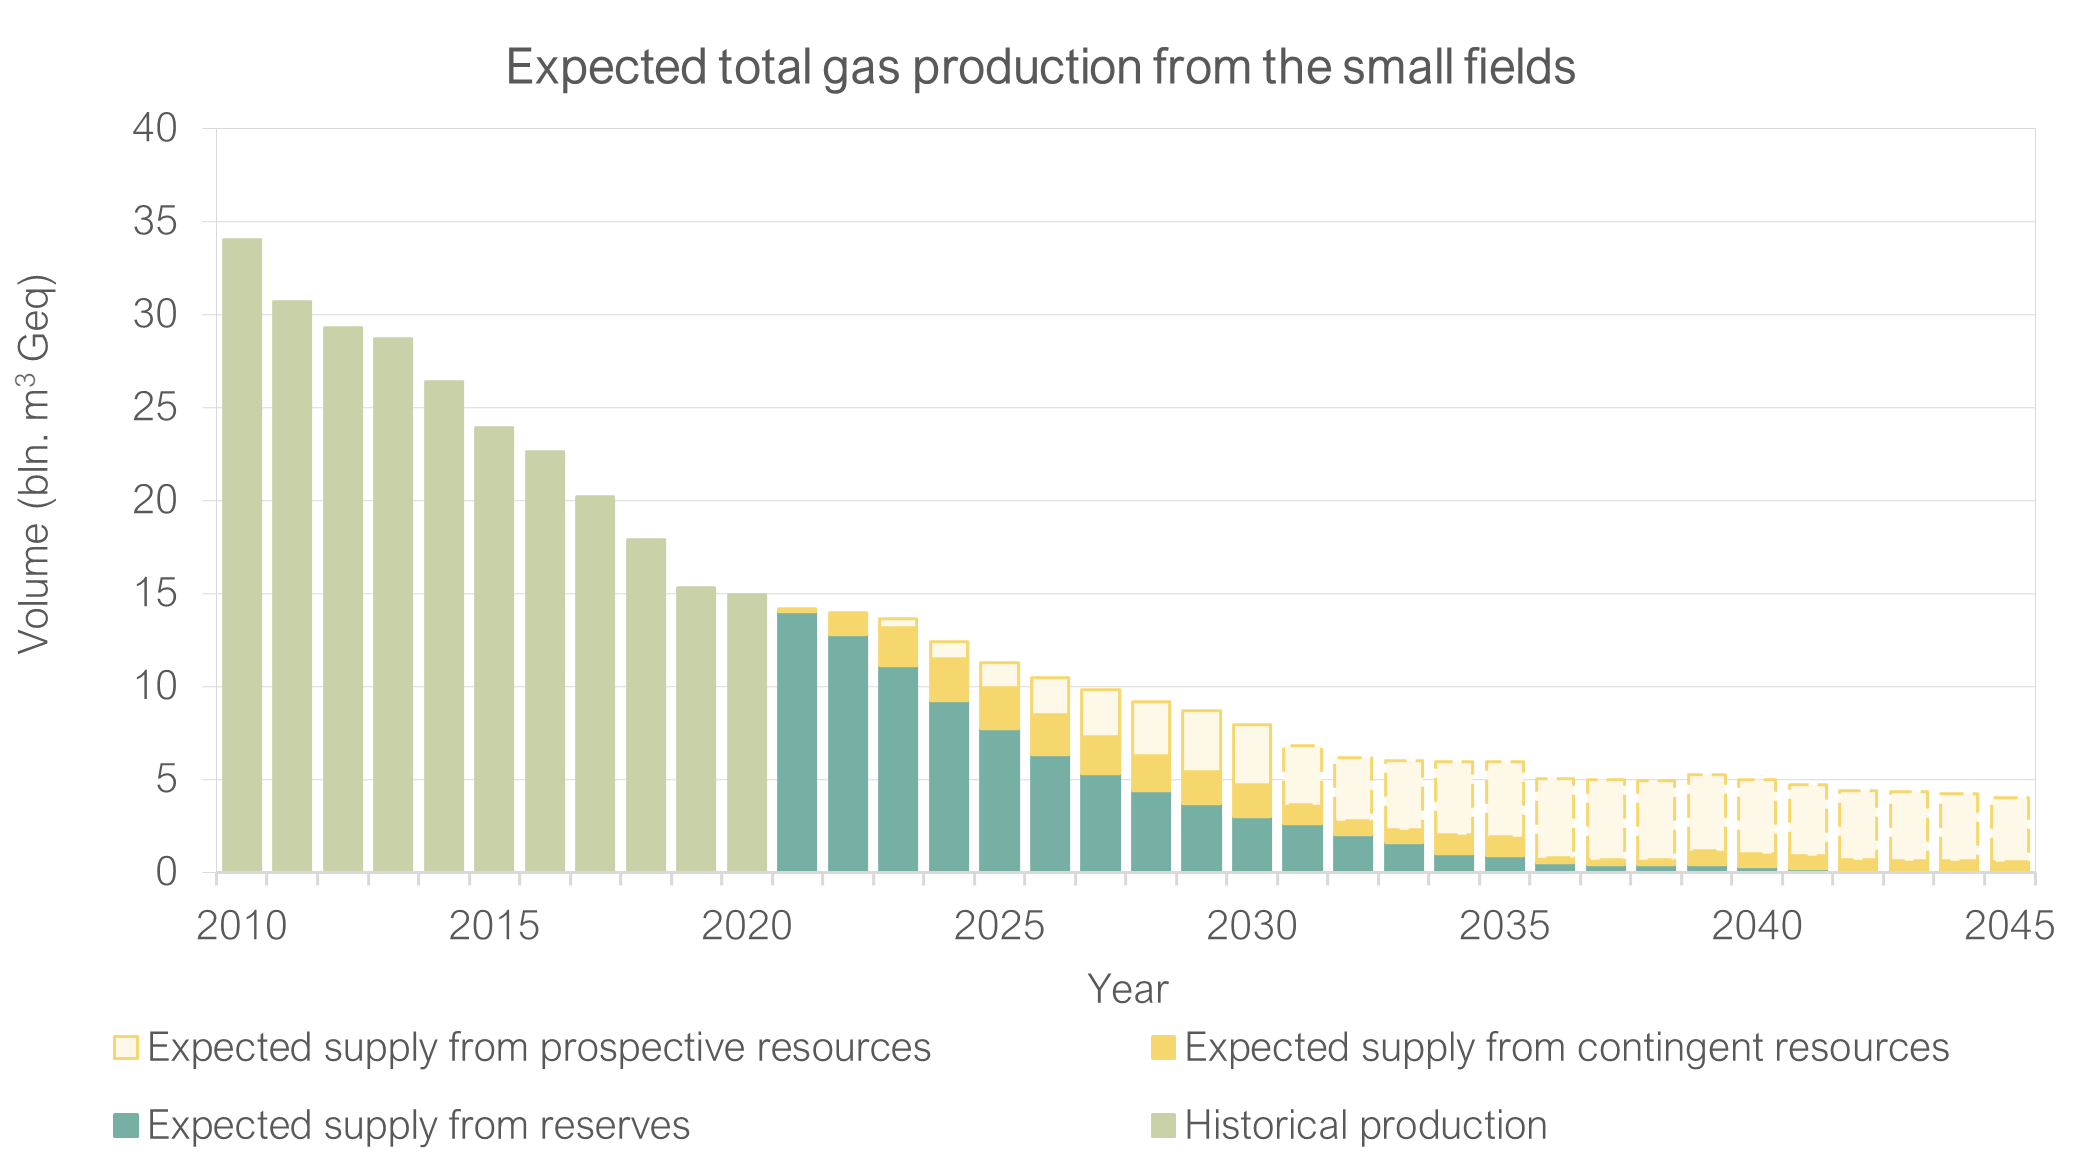
Expected production of natural gas
Current Dutch government policy is aimed at maintaining domestic gas production, especially in the North Sea. This is in view of the rapid decrease in production from the Groningen field and (for the time being) still high domestic gas demand. Natural gas from the Netherlands has a lower carbon dioxide footprint than imported gas and it contributes substantially to the Dutch economy. Moreover, gas produced from the North Sea has less impact on society than gas extraction on land. At sea, on the other hand, the time pressure caused by the dismantling or conversion of the infrastructure must be taken into account. Due to the depletion of an increasing number of gas fields, the existing infrastructure is gradually abandoned and removed or possibly reused for transport of CO2 to underground storages in empty gas fields. In addition, there may be future developments such as the transport of hydrogen from wind farms to the coast. The lack of an available gas infrastructure that can be shared makes it more difficult and economically less attractive to develop new gas fields.
In order to improve the financial investment climate for gas development, the tax deduction for investments in gas in the North Sea has been extended to 40%, which applies to all investments. This is a significant change from the previous 25% investment deduction which applied for a limited number of marginal gas accumulations. This measure is expected to have a stimulating effect on exploration and production efforts.
Estimated production
The estimated domestic production from the small fields is based on the following:
- The summation of the profiled reserves and contingent resources from the subclass ‘development pending’. These profiles have been provided by the gas producers in their annual reports (in accordance with article 113 of the Mining Decree).
- The summation of the simulated production profiles of as yet undiscovered accumulations. These profiles have been prepared using a simulation model that takes into account the number of wells expected to be drilled (11 exploration wells per year and a minimum risked value to investment ratio (RVIR) of 0.1), the expected recoverable volumes of the prospects, the expected productivity of the well and the possibility of success.
- The production of the reserves in underground gasstorage facilities (i.e. that part of the gas that at conversion to UGS was originally present in the reservoir) has not been taken into account in the prognosis of production. This as the timing of production of this gas is highly uncertain, currently this is not expected to start before 2040.
Oil resources
On 1 January 2021 53 proven oil accumulations were known in the Netherlands. Eleven of these oil accumulations were in production and it is expected that 4 new oil accumulations will start with production in the next 5 years.
Number of proven oil accumulations as at 1 January 2021.
|
Status of oil accumulation |
Land |
Sea |
Total |
|
I. Developed |
|
|
|
|
Producing |
3 |
8 |
11 |
|
II. Undeveloped |
|
|
|
|
a. Production start 2020 - 2024 |
0 |
4 |
4 |
|
b. Other |
10 |
16 |
26 |
|
III. Production ceased |
|
|
|
|
a. Temporarily ceased |
0 |
0 |
0 |
|
b. Ceased |
8 |
4 |
12 |
|
Total |
21 |
32 |
53 |
Oil resources as at 1 January 2021
The resource estimates are based on data and information submitted by the operators in accordance with the Mining Act. The estimates follow the Petroleum Resource Management System (PRMS, SPE, 2011). The Table below shows the reserves (i.e. part of the resources that can be produced commercially and have been qualified as such by the operators) and the subclass ‘production pending’ of the contingent resources, for which it may be reasonable to consider as commercially recoverable, but do not yet meet all the criteria. The remaining subclasses of the contingent resources that have a greater uncertainty regarding the eventual realisation (i.e. on hold, unclarified or unviable) are not included in the Table below. Because the PRMS is a project-based resource classification, both reserves and contingent resources may be present in one accumulation.
The total oil resources as at 1 January 2021 amounts to 29.6 million Sm3, made up of 11.6 million Sm3 in reserves and 18.0 million Sm3 in contingent resources (development pending).
Oil resources in million Sm3 as at 1 January 2021.
|
Area |
Reserves |
Contingent resources (development pending) |
Total |
|
Land |
9.2 |
5.0 |
14.1 |
|
Sea |
2.5 |
13.0 |
15.5 |
|
Total |
11.6 |
18.0 |
29.6 |
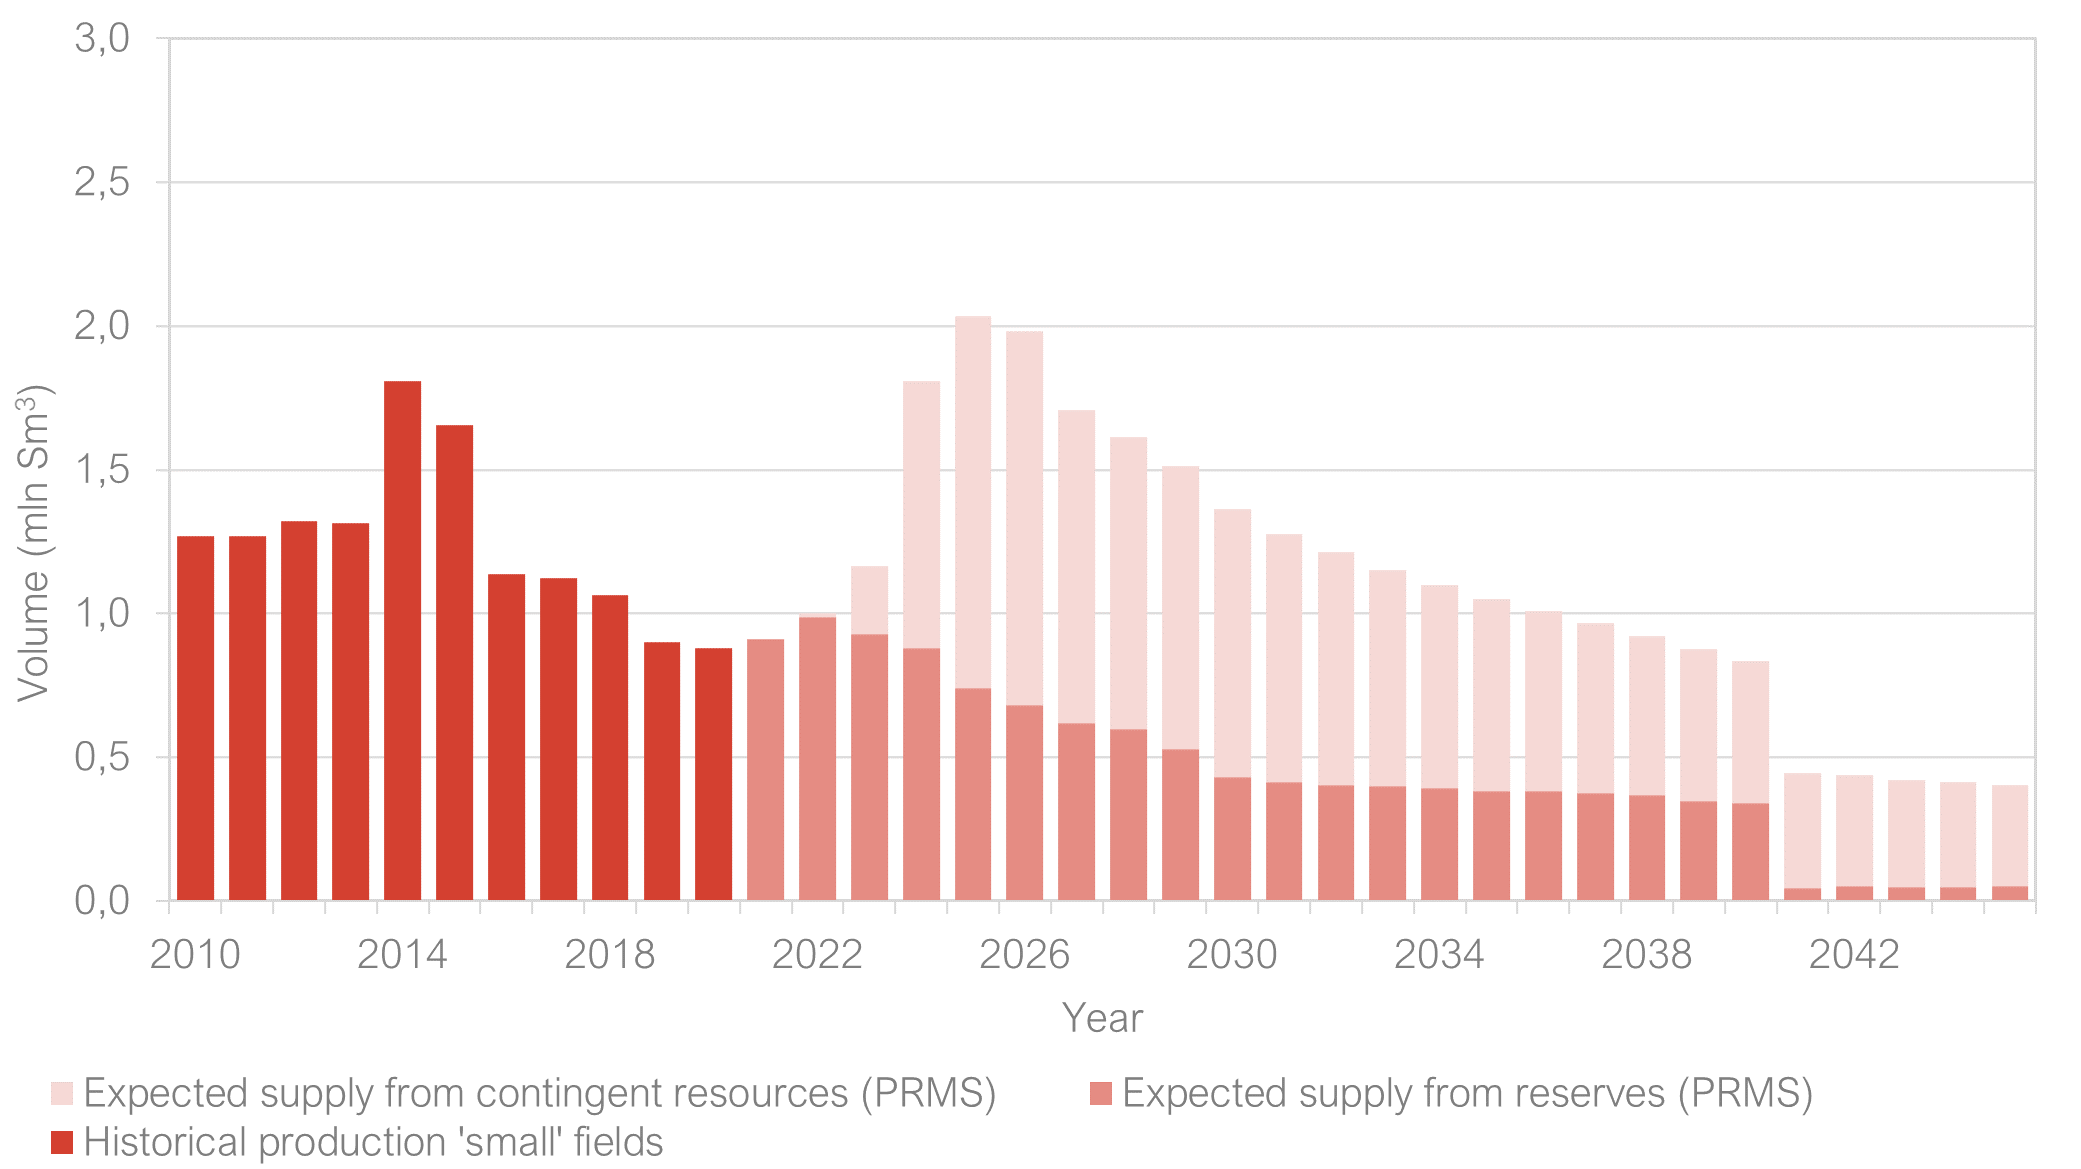
Forecast
The forecast is based on the operators’ annual reports. Relative to the expected production for 2020 (1.2 million Sm3) the realised production fell short by -20 %. As some oil fields are downgraded with respect to last year, the corresponding reserves are now classified as contingent resources. In the profiling, this is reflected in an increase in expected supply from contingent resources from 2024 onwards. The abrupt decrease in production in 2041 is due to the fact that production forecast of a number of fields is limited to the year 2040. The profile has a certain degree of uncertainty as the number of producing oil fields is small, any changes in forecast will have a noticable effect on the cumulative profile.